The OECD has reported that “Annual plastics production has more than doubled in the last two decades and is projected to triple by 2060″[OECD]. The world in which we live is far from the Barbie movie of Summer 2023 – Life in Plastic is not fantastic. Between pollution, mismanaged waste, general consumerism, and ecological destruction, plastic is something that has given humans choice and flexibility but it needs to be far better managed. Using OECD data, let’s take a look at the last 20 years of plastic – in particular, it’s mismanagement.
Before we jump in there are a few factors we should consider before reviewing these results like median salary, education and population size. As economies grow richer, their penchant for disposing of waste grows. The rapid growth of China’s waste is not because of a rapid growth in population, it correlates with that nation’s wealth. China’s Plastic Waste, Leakage, and that collected for recycling grew by 75% in 19 years. Statistics like this make the OECD projection easy to believe. So if we want to be richer, do we need to be more wasteful? Not necessarily. Canada’s population in 2019 was approximately one-tenth of the United States, and yet the United State’s plastic waste was 90% more. Although China had a population size of 1.4 billion in 2019 and the United States had one of 328 million, the US’s plastic waste was still 10% more.
Let’s take a look at the end-of-life fates recorded for the same Country/Region set:
Recycling is not the answer because the waste should be reduced in the first place. Creating a more circular economy and lifecycle for plastic that is required/used is one way we can reduce our footprint. Reduce, reuse, recycle – apparently not such a simple cycle that my primary school would have had me believe. In 2019 from this data set, we can see how much certain countries/regions recycle of their total waste: 14% EU, 13% India, 12% China and 10% Latin America respectively. Recycling does not make up for other waste mismanagement, however – it’s like a plaster on a bullet wound.
If we’re to approach the problem holistically as one unified world while also ensuring poorer nations get the chance to catch up economically without being consumed by consumerism, it’s a harder issue to solve. It starts with individuals however and people like you and me choosing not to use more plastic, opting for eating in rather than taking out and unlearning convenience. We can see below how our waste has doubled in the last two decades, what can we do to reduce it or at least avoid tripling by 2060?
Overall, in 2020 global plastics use declined by 2.2% compared to 2019 levels. However, with a rebounding economy, plastic use has picked back up again. Single-use plastics lead to the fact that the more we consume, the more we waste it appears. Aiming to reduce personal single uses saves you money.
Data Source: https://www.oecd-ilibrary.org/environment/data/global-plastic-outlook_c0821f81-en
Depending on your level of engagement with corporate America, you may be quite familiar with the term growth mindset. For those of you who are aware of it, hear me out because I’d like to add a little flavour to the bland overuse of the term.
Does anyone else look back on the initial lockdowns and think they went by pretty quickly?
Just me then? Ok cool.
For those of you who may have found themselves agreeing with my initial statement, it is probably because you were as bored out of your tree like me. You were under-stimulated mentally, you weren’t having any new experiences and so days were less memorable and blurry. Days were as indistinguishable as the Fast and Furious film franchise. You weren’t being challenged to adapt like you were on public transport or in traffic on the daily commute, you weren’t subconsciously people watching or scanning. When you’re bored, time goes slowly in the moment but when you look back your memory deceives you and blends the time period. You may remember individual bright spots of your lockdown experience – being proud of making your first banana bread, relishing working from home in your pyjamas, or the pain you felt of doing an at-home workout session.
Our memory is the inventory of our learnings – we have to learn people’s names, our neighbourhood, how to make a good cup of tea, and how to do our job. We dip in and out of this inventory so seamlessly it is something we should appreciate more often. As a child we’re taught the difference between good and bad – don’t steal, don’t hit, do eat your vegetables, do say please and thank you. There is no handbook for us all to learn the same foundational learnings of existing in a society. We grow up learning to be scared of bees because our parents have a fear we’ll get stung, but then we learn about the environment and how integral bees are to our world and celebrate them. We’re capable of learning and unlearning and relearning. And most importantly every human is worth teaching.
Diversity of brain types, genders, races, tastes, fashions, languages, thoughts and lifestyles – a celebration of all of it but also recognition of differences. Creating an “us” and “them” is a slippery slope and usually infers a “right” and “wrong”, but truly valuing diversity and wanting to learn about the differences is to me what a growth mindset really is. You’ll never meet someone who doesn’t have something to teach you, whether they’re a toddler or 102, and you’ll never meet someone who you don’t have something to teach. Recognising that transferring knowledge and learning to communicate in a respectful way is a life lesson. You may not feel able to communicate with some people, world leaders in particular, respectfully because you’re aware of their viewpoints and actions before they open their mouths. Recognise however you’ve something to teach them and no doubt they’ve something to
Each one of us has a global impact, whether we like it or know it. The recently increased outpouring of frustrations and powers that be is nothing new. Throughout the ’60s, ’70s, and ’80s we saw some of the biggest protests this world has ever seen – all organised without instant messaging or GPS. An estimated 20 million people partook in protests during the first Earth Day in 1970. We now just protest online it seems and get mad with others who we may not have met in person or don’t even know the name of. What does that actually do other than just cause further frustration and anxiety?
A growth mindset to me is about learning – but particularly a willingness to learn through dialogue and experience. I hope for our sake, that long-form text is never fully replaced by emojis and expression is full of words that describe how we actually feel and not the base simplistic emotion. We try and simplify our words and shorten them to 140 characters but how can you really convey full sentiment in this?
Grow your mind in many ways like going to the library, seeing a play, or taking a different way home – you can grow your muscles through multiple forms of exercise, your mind is a muscle that needs to be kept in shape too. Make your days distinguishable, make them different, in even the smallest way possible. Take from your life as much goodness through simplicity as you can.
Grow your mind and your mindset, and you’ll grow your whole being.
Everything is a system, and by this definition, we’re a part of many different systems. Societies we live in, companies we work in, families we are a part of, and sports clubs we play in are all examples of systems. These systems can be owned, managed, and changed over time. It is my belief we’re at a pivotal moment in how our world, societies, and systems fundamentally operate. The systems I have lived in and witnessed in my short time on this earth seem to be broken. Thinking in Systems (a book by Donella H. Meadows which I recommend to anyone) reviews how some of the biggest problems facing the world today like war, environmental degradation, systemic inequality are system failures. The war in Ukraine cannot simply stop overnight, flora and fauna cannot be brought back from extinction, and 2020 educated many on how systematic racism is still rife in the United States after many decades of activism. These larger issues cannot be solved by fixing one thing in the broken system in isolation. For example, it is hard to get women into tech and STEM subjects but no amount of increased advertising of girls coding will change the culture of the software industry to be accepting of girls, because even seemingly minor details have enormous power to undermine the best efforts of too-narrow thinking.
For the past number of years, I have seen a growing sense of hopelessness, and feelings of dejection among my friends and people my age on social media.
We’re asked to vote as adults in societies that don’t really have a track record of ever serving young adults.
We are raised with the knowledge that working in companies that are behemoth monopolies with GDP higher than the majority of countries in the world, is an admirable job to have (In 2021 Amazon’s market cap grew to $1.7 trillion this is larger than 92% of country GDPs – Visual Capitalist Link).
When we raise our hand to discuss crippling debt and unattainable lifestyles that our parents had before us we’re just told to work harder.
I find it angering, confusing, and anxiety-inducing to live in a world where I am expected to participate and contribute but yet I feel unheard and unseen. Since the start of 2020, I have been researching, consuming, reading, and digging on potential causes and remedies for this broken system because it’s not a simple fix. I am going to start using this blog to examine how growing up in such a capitalistic society has shaped my outlook and reflect on how I try to unlearn and break these beliefs.
If we want answers on why we’re in the state we’re in, we need to look to the good aul US of A. Post WW2 the United States of America was one of the few major first-world countries with no destruction. With a relatively uninterrupted localised supply chain (nothing was really as global then as it is today), citizens who were focused on upward mobility, and opportunities available, consumerism was born. And where the United States leads, Australia, the United Kingdom, and the European Union follow. And where the West goes the East competes. What we have today is the product of international trade, the explosion of the 4th industrial revolution, and the introduction of technology. Due to this extremely simplified view of the past 80 years, we are now living in corpocracies, i.e. societies in which corporations have much economic and political power. I’ll examine the history in greater detail in future posts.
We now live among mini economic zones that present as companies, but really are so much, much more. The cornerstone of some country’s GDP growth and success are these large companies. For example, Samsung contributes approx 20% of South Korea’s GDP and some liken South Korea to the “Republic of Samsung”. Vice recently did a video on South Korea’s Chaebols (successfully large conglomerates run by families) and their effects on society. The power that these Chaebols, or any large company owner, wields is pretty unfathomable. For example, in 2014, the story of the Nut Rage scandal broke where the daughter of a Korean Air CEO had the plane she was on turned around to New York so a flight attendant could be removed. All because she was served macadamia nuts in a packet rather than in a porcelain bowl. This situation has played out, the employee compensated, and warranted public shaming ongoing. If I acted like this in my daily life, I’d lose my job, probably friends, would be treated as a terrorist and would definitely avoid no jail time. These owners and children of owners are judged in the court of public opinion but nothing seems to ever really happen to them.
Not all these tantrums are solely for personal gain – there are also vanity and narcissistic asks made by big business owners. One of my personal favourites was in 2018 when Jeff Bezos, then CEO and founder of Amazon, was looking for a new second headquarters for his colossus. Mayors and state officials began to bend the knee and kiss the ring, and New York had won out by offering nearly $3 billion in government incentives. But Amazon is not above public opinion, bad press, and backlash from lawmakers and subsequently reversed the deal in early 2019. To read more on the timeline here is a good New York Times article.
This is not an article to bash big companies and declaring they shouldn’t exist. On the contrary, I think international diversity of thought makes better products for everyone. Bigger companies mean more offerings for consumers which usually means better prices. Companies can truly contribute to societies and countries they operate in by offering great products, by offering gainful employment, but also by paying sufficient tax. In early 2023, Ireland will eventually become a member of an OECD agreement to overhaul taxes on large corporations, but we certainly dragged our feet. In 2023, companies that have revenue in excess of €750 million ($868 million USD) will be required to pay 15% tax, rather than our infamous 12.5% which big tech knows and loves. However, single or widowed individuals they pay 20% tax on €36,800 and 40% on anything above that. Why are big businesses not at least on par with Irish citizens?
Annual earning declarations demonstrate how subsidiaries of these global giants take advantage of knowing that tax evasion is illegal and tax avoidance is legal. We now have 24/7 coverage of the world, and therefore we have a tidal wave of continuous evidence of how our systems are broken and don’t serve the people they’re intended to serve. The system is sick and we’re all developing symptoms of the same illness.
Feedback is important but it is also important to recognise that it is another person’s perspective and it can be based on a few interactions. It may not be a true representation of you but it is something valuable to consider and be aware of. Something I try to do is not wait for an allocated feedback time – if you have feedback try and give it real-time and if you want feedback on something ask for it in real-time.
If you wait for an anointed time to give feedback you may find you’ll be scrambling to think of something meaningful to say to the other person. If you wait for an anointed time to receive feedback you may receive some comments that are based on recent experiences rather than your general working style.
Here are some tips for asking for feedback
Don’t wait for feedback. If you have just completed a big body of work or landed a major project don’t forget to host a retrospective but also don’t forget to ask your team members how individually you could have done better. Having a growth mindset at all stages of your career is important to help you keep learning and keep progressing.
Ask open-ended questions. Direct your questions towards tangible pieces of work like certain projects, instances, or experiences you want feedback on. In Celeste Headlee’s TED talk on ways of having better conversations, she mentions how using open-ended questions will aid you to get an open-ended answer.
“How would you have done it?”
“What tools would you have used?”
“When would you have started talking to XYZ stakeholders?”
Seek multiple perspectives. Feedback is someone else’s opinion about you, your working style, skills, etc. You can actually just take it or leave it. If you receive some feedback however that surprises you or you did not expect it, why not ask another one or two colleagues specifically about that attribute.
For example, you may receive feedback about your communication style and your ability to ask direct questions from someone you worked on a project with. Why not ask your manager or someone else on your team if they agree with this piece of feedback. This confirmation or dismissal of the feedback may indicate an area you can grow.
Self-feedback is important too. Writing notes on self-reflection about experiences where a skill you want to work on could have been better is a good method of this. Although sometimes time-consuming, self-reflection is a really good exercise to help you work on areas of yourself that you yourself have identified.
Here are some tips for giving feedback
Don’t wait to give feedback. Very similar to asking for feedback, if you have just finished working quite intensively with someone make sure you give them feedback either positive or constructive.
Give balanced feedback. Try and tell the other individual or team something you want to keep seeing that they are doing well and something they could do better. At work, we all try our best but deadlines, priorities, and volume of work can get in the way of us doing something in a way we’d want to do if we had time. Recognising that we’re all trying our best and we’re all human is important.
Explain your perspective. Whether you are a customer, a team member, a manager, or a mentor/mentee, it is important to explain the perspective you are coming from. Particularly when giving some constructive feedback, reinforcing that you don’t hold all the answers or your view may be limited and therefore biased can help frame the feedback better and make it more actionable. At the end of the day, you give feedback because you want to help and make your team members better, not to give them a complex!
This list is non-exhaustive and is based on personal experience. These points are aimed at Computer Science or Data Analytics students but some of them can be applied to students of any course or degree type.
Start college by creating and following your own learning paths that interest you. They can either complement your course or being completely separate.
Have part-time projects you personally are interested in and document your learnings. Self-motivated learning has been proven to create more successful students (Pintrich and De Groot, 1990). If you will be writing a thesis in your final year, work with your lecturers and see if you can incorporate such topics into your studies.
For example, if you are interested in video games, have a look at game modification, “moding”, communities and seek ways to contribute.
If you get good enough at a particular part-time skill you could do some parttime consultancy work.
Join a college society and see how you can add your technical spin. For example:
Join the drama society and practice light and sound design
Or join the Japanese society and set them up a website
Get an internship in your direct field of study, at least once, during the summer between years. You may not have a network to get the “best” internship but any experience is better than none and will help you get a better job out of college!
Ask your lecturers for help
Ask your family for help
Go to recruitment events and careers fairs
Do not be afraid to reach out to people directly on LinkedIn
Set up a LinkedIn account. Do not be threatened at the calibre of some people’s profiles. The best candidate will make every decision, step and change seem intentional, when in reality they got one job by chance, they took a risk and did not know how it would work out or they did not love every moment of the experience but they got a lot from it.
Set up a GitHub account and post your college projects, assignments, and homework here.
Socialise with people in years ahead of you, understand what they are going through to set your expectations for years to come. Chat with people in years behind you and see if you can mentor or help them.
Do your homework on different technologies out there and that are used in industry. If you want to work in a particular company find out or ask what technologies they use.
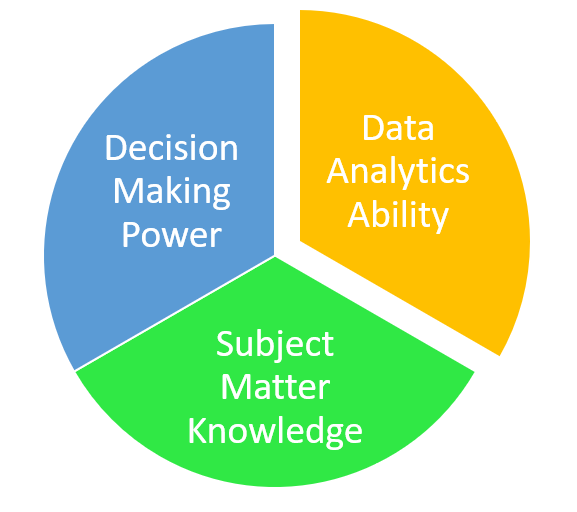
If you are interested in data analytics, try and focus in on a field of study you are interested/motivated to analyse. Data analytics there are three areas you can have influence in analytics ability, decision making power, and/or subject matter expertise. An individual will usually have one and grow into another. To be a strong analytics candidate, why not grow your analytics ability in college.
References
Pintrich, P.R. and De Groot, E.V., 1990. Motivational and self-regulated learning components of classroom academic performance. Journal of educational psychology, 82(1), p.33.
The Irish property market (renting, private, commercial) has enjoyed an incline of success since the 2008 global recession. This rise has not been devoid of skepticism or fallout for the average Irish renter or first-time buyer. A United Nations report has highlighted how the Irish government is supporting offshore benefactors to profit from a poorly regulated property market by allowing them to register as charities (UN for Human Rights, 2019). This open letter from the UN (2019) to the Irish government highlights how adequate housing is a human right. Newspaper headlines and exposés are consistently quoting shocking levels of habitations in normal houses, for example, “16 people in a single bedroom, 64 people renting a house” (Journal.ie, 2017). Such tales are reminiscent of the history books and tenement housing during English rule in Ireland.
The objective of this project is to test if the current European Union (EU) regulation is working or if there are areas of improvement. The ideal outcome of the study would be to help European governments with planning to supply the current and future demands of their respective housing markets. This study will attempt to give insight into the type of dwellings needed in a country/city such as the proportion of social vs private housing levels required. The initial overall EU review will enable the final report to give specified insight and recommendations for the issues in Ireland.
The need for such a study is that there is currently a housing crisis in Ireland and across other countries and capitals in Europe. There has been a crisis mounting for the past number of years, specifically in Dublin, with rents rising by 84% since they “bottomed out” in 2011 and the purchasing power of the average house hunter has decreased by 48% (DAFT.ie, 2019). The OECD reported that although Ireland ranks well above the global average for personal security, health status, education, and work-life balance, it ranks below average in income, wealth, and civic engagement (OECD, 2019).
Knowledge
from big data and data mining modules will be used to explore data and create a
predictive model. Skills such a data visualisation will be utilised to present
results and create a usable product. Business communication and analysis skills
will be used to communicate results and manage this project.
The objective of this project is to help European governments with housing planning, for now, and the future, it is quite broad. The purpose of this section is to better define the scope of the study in terms of requirements, specifications, and constraints.
A requirement for this project is that all datasets used must be of a specific size (>20k lines of data), from a reputable source, and must be publicly available. The data source identified that fulfills this criterion is Eurostat, a European Commission sponsored website that provides factual European datasets. The datasets that will inform this study are under the categories of Population Projections (proj), Population and housing census (cens), and living conditions and welfare (livcon) (Eurostat, 2020).
The required output of this project will be an interactive visual dashboard to enable end-users to visually compare different European cities and regional housing needs and standards. This dashboard will be used to highlight areas of forecasted housing issues. Such predicted issues will be built out using Eurostat forecasted EU populace figures.
Using a statistical method for estimating House Price Index (HPI), an indication will be given to the types of conditions, costs in particular, for future EU citizens (Garg, 2016).
For the final written report, a case study will be created reviewing a few specific cities across Europe, one of them being Dublin, Ireland.
A European Commission 2006 report noted that “the quality of housing conditions plays a decisive role in the health status of the residents” (WHO, 2006). The EU as a governing body is consistently striving to administer regulation and innovative regulatory frameworks to protect its citizens and their health. The standards and regulations that the EU reaffirm each year in terms of housing will be tested during this project. The outcome of this project will incorporate a rating for each country studied in terms of the EU standards. Using comparative measures between the mentioned HPI, social living conditions of EU citizens and ultimately the EU standards will give insight to the issues in the EU. The aim of utilising these standards in the final report will be to highlight if they are working or if there are areas of improvement.
When initially researching topics and datasets for this project, the open availability of relevant and real-time housing data was a constraint. Post-GDPR, information from EU property websites is more difficult to attain. This constraint decided the area of study being around the EU regulations and EU citizens rather than one populace.
Due to the expansive nature of housing as a global problem and the potential impact and application of this study, the study itself will be purposefully constrained. The review will be constrained to housing conditions, populations current and potential and application of the regulations and specifications noted.
The proposed project’s aim is to troubleshoot methods of alleviating the housing issues across Europe, starting with the policies and standards that govern us all. Other studies of this nature have been completed prior to this for other geographies and societies. During the review of existing literature on the subject, it was noted that much of the data used for socio-economic indicators were received through surveys (Juhn et al., 2011; Börsch-Supan, 1990). Surveys were necessary to match the type of socio-economic background of the people given in a certain house. It was also noted that house type showed some level of correlation with the socio-economic status of those surveyed (Juhn et al., 2011). A survey of the required or necessary size will not be possible for this study. Considering these studies, and the level of importance placed on surveys, finding and choosing a dataset was the first real challenge for this project. Considerable effort was put into acquiring relevant and recent data, which was impacted by GDPR, complete datasets and relevant data.
A similarity was
noted between literature reviewed; the main technological point that serves previous
studies and will serve the proposed problem scope is the technique used for
review. Regardless of the location chosen to review housing and socio-economic
issues, criterion and construct validity will remain the same (Juhn et al.,
2011; Börsch-Supan, 1990). Also, notable studies completed in the United States,
Latin America, and Spain highlight different methods of measuring
socio-economic metrics through housing (Juhn et al., 2011; Arias and De Vos,
1996; Amérigo and Aragonés, 1990).
An advantage of the papers reviewed is that their aim is to form or drive policy. Their experimental natures enable further learnings for this report and project. The disadvantages of the papers reviewed is that they are not totally relevant to the types of datasets that will be used for this project. This incurs the need for further study and application time for this project. It is also noted that the literature used for review for this study is, in some cases, thirty years old. It was noted however the methods used, and measures taken are still relevant to the modern day. The aim of the papers reviewed was to increase the health and satisfaction of people in houses. It was seen that many such studies are published to psychological journals due to the type of negative impacts can have on inhabitants of poor dwelling standards.
The Artificial Intelligence (AI) Hierarchy of needs, like
that of Maslow’s, introduced by Monica Rogati (2017) is the structure in which
this project will be approached. The approach is listed as the following
headings.
As the
problem proposition has been defined the information and data needed to be
collected has been identified. The Eurostat data was collected through census
information and logging EU member nations information through electronic means.
The information from Eurostat will be downloaded locally for the purpose of
analysis.
Excel and R
Studio will be used to explore the data from Eurostat. There are some gaps in
years and labels noted which will require some data cleaning. Data cleaning
techniques have been learned during the big data module.
Tabular data
is usually used for machine learning algorithms, however there is a lot of
relational datasets, including those being used for this study, to be explored
(Larionov, 2019). Aggregate functions will be explored using SQL, but an
attempt to use Python Pandas package agg function will also be used (Larionov,
2019).
Using the
aggregate functions, a neural network will be built to learn from them. Pearson’s
correlation coefficients between housing census (cens) and living conditions (livcon),
like in Juhn’s et al. (2011) study for criterion validity. For construct
validity, the association between houses census (cens) and social welfare
outcome. The chosen HPI in Section 2 will be utilised to forecast the housing
costs for the given region. Figure 1 shows the schematic diagram for the work
that will be done.
Figure 1: Schematic diagram of the proposed project
The scope of
the initial research was to find a perspective project. Once a problem deemed
worth investigation was identified requirements were gather and scientific
papers were reviewed. Data insights are then necessary to be gathered and this
will assist the methodology to be used. The deliverable from this is a detailed
project execution plan.
Once the research is complete and the data found the task then is to slice the data and create different exploration counts, distributions and histograms. A deliverable of this will then report such results in the interim project report due in a few weeks. The modeling step is dependent on successful data exploration and cleaning.
As specified
in Section 4, ETL is a task of this project. Once ETL is complete, the model
can be trained and evaluated. The model can then have metrics and baselines
created to compare the initial model output to. A deliverable of this task is creating
a model prototype and have an evaluation report.
A/B testing
of the model is to be done and analysis of the results received are to be
reviewed. Reporting on these results will enable hypothesis informing for fail
and succeeding. The model is should then be optimised by trying to better
runtime and memory usage, commenting/cleaning code and producing a finalised model.
The final deliverable of this project, once the model has been created, is to create
an interactive dashboard for the end user to use. Tableau will be used to
create this dashboard.
As
stated in the introduction, the problem being analysed is very current and
relevant. A personal aim of the project for the author is to explore this
rampant problem more thoroughly and hopefully publish some findings that could
impact the current issues at hand positively. As mentioned, this topic is
emotive for many and as seen in Figure 2 this report has been submitted late
due to the author’s own emigration from Ireland. The engineering and project
management approaches chosen, have been tried and tested on different reputable
data science blog sites. ultimately the aim of this study is also to manage
this project successfully while learning and acquiring some new data analytics
skills.
Arias, E. and De Vos, S., 1996.
Using housing items to indicate socioeconomic status: Latin America. Social
Indicators Research, 38(1), pp.53-80.
Amérigo, M. and Aragonés, J.I.,
1990. Residential satisfaction in council housing. Journal of
Environmental Psychology, 10(4), pp.313-325.
Bezerra, G. (2019). How to
manage Machine Learning and Data Science projects. Available:
https://towardsdatascience.com/how-to-manage-machine-learning-and-data-science-projects-eecacfc8a7f1.
Last accessed 8th Feb 2020.
DAFT.ie. (2019). 2019 Q1
Rental Report. Available:
https://static.rasset.ie/documents/news/2019/05/2019-q1-rentalprice-daftreport.pdf.
Last accessed 3rd Feb 2020.
Eurostat. (2020). Database. Available:
https://ec.europa.eu/eurostat/data/database. Last accessed 7th Feb 2020.
Garg, A., 2016. Statistical Methods
for Estimating House Price Index. J Bus Fin Aff, 5(231), pp.2167-0234
Juhn, Y.J.,
Beebe, T.J., Finnie, D.M., Sloan, J., Wheeler, P.H., Yawn, B. and Williams,
A.R., 2011. Development and initial testing of a new socioeconomic status
measure based on housing data. Journal of Urban Health, 88(5), pp.933-944.
Larionov, M. (2019). Learning
aggregate functions. Available:
https://towardsdatascience.com/learning-aggregate-functions-5b4102383433. Last
accessed 8th Feb 2020.
O Faolain, A. (2017). Documentary
shows state of Ireland’s rental ‘nightmares’. Available:
https://www.thejournal.ie/private-rental-conditions-3676961-Nov2017/. Last
accessed 3rd Feb 2020.
Rogati, M.
(2017). The AI Hierarchy of Needs. Available:
https://hackernoon.com/the-ai-hierarchy-of-needs-18f111fcc007. Last accessed
8th Feb 2020.
United Nations Human Rights Commission. (2019). UN
Special Rapporteur Condemns ‘Financialisation of Housing’. Available:
https://www.ohchr.org/en/issues/housing/pages/housingindex.aspx. Last accessed
8th Feb 2020.
World Health Organization, Regional
Office for Europe and The French Ministry of Health. (2006). Housing and health
regulations in Europe. EUROPEAN CENTRE FOR ENVIRONMENT AND HEALTH BONN OFFICE. (Final Version).
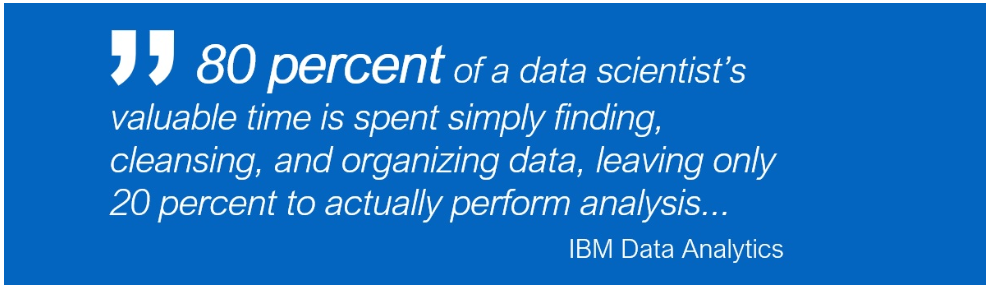
Within the past two years, 90 percent of the world’s data has been created. Sharing personal data daily online, such as communication, pictures and opinions, has become the new normal. This global level of comfort with sharing data has impacted the way in which a consumer interacts with financial institutions. With increased data sharing tendencies of consumers comes greater responsibility from intuitions to store and use the data received ethically and compliantly. Another noted trend among consumers over the past decade, is choosing trusted firms over the cheaper options. This review highlights how financial services institutions can build trust with their consumers through their choice and design of data mining techniques and illustrates two specific applications. Building a trusted brand has been proven to increase an entity’s competitive edge and so, in the midst of a global slow down, trust has become a more relevant strategy to retain and attain financial customers.
Introduction
The
financial industry (banking, fintech and big tech) has enjoyed an incline of
success since the 2008 global recession. This rise has not been devoid of
scandal and considering the industry’s cyclical nature, this time of prosperity
is widely predicted to end, or at least slow, in the coming financial year. Newspaper
headlines are consistently littered with cautionary tales of financial data
breaches and defiling of unsuspecting users’ trust. We are still in an age
however, where financial services customers are more willing than ever to share
data, so long as their data is used to personalise offerings and technology to
their needs (Accenture, 2019). The profile of consumers is changing also, along
with users’ level of comfort with technology. 74 percent of millennials are
willing to share personal data with banks versus 49 percent of those 55 and
over (Desjardins, 2019).
The aim of this review is to explore how financial services businesses can build and maintain consumer trust through the data mining techniques chosen and mining applications. Trust is as, if not more, important than cost to consumers (Kim, Xu, and Gupta, 2012). Considering this, the emphasis on a financial firm’s Corporate Social Performance (CSP) strategy and methods of increasing its CSP will be highlighted during this review (Pivato, Misani, and Tencati, 2008). It has been shown that CSP influences consumer trust which subsequently impacts a consumer’s actions and ultimate provider choice (Pivato, Misani, and Tencati, 2008). In a bottom-line motivated industry, the monetary advantages of using a CSP as strategy north-star must be emphasized.
Brand equity is a term globally synonymous with acceptance of premium prices by consumers. It has been shown that brand trust is one of the main strategies to infer brand equity and reinforce customer loyalty (Delgado-Ballester and Munuera-Alemán, 2005). To ensure global brand equity as a relational, market-based asset, companies in every industry must build brand trust (Delgado-Ballester and Munuera-Alemán, 2005). The hypothesis of this review is that a brand can build trust through the data mining techniques chosen and can continue to propagate trust through chosen technique applications.
Techniques
Data mining utilises some machine learning techniques that enable machines to learn from their own performance which helps facilitate prediction of trends and discovery of unknown patterns in a given dataset (Chitra and Subashini, 2013). The underlying algorithms and techniques being used to mine data have ultimately not changed since the late twentieth century, but the level of data, purposes, motivations and boundless application potentials of mining techniques have increased exponentially (Berry and Linoff, 2004). An assumption being operated under for the purpose of this paper is that preserving privacy builds trust with consumers. In the following subsections, methods of data mining that preserve privacy as well as a framework to be used to ensure responsible data science will be highlighted.
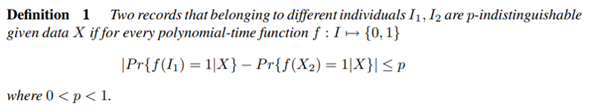
a. Methods to ensure anonymity
There are a variety of functions required from data mining algorithms in the financial sector: classification, regression, attribute importance, association, clustering, feature extraction and anomaly detection (Chitra and Subashini, 2013). These functions can be further separated into two categories: supervised and unsupervised learning functions (Chitra and Subashini, 2013). Prior to choosing any one of these functions to apply to a banking scenario, there are a few criteria of the technique to be considered to be privacy-preserving. Clifton et al (2002) highlight these criteria, which include secure multiparty computation, obscuring data, the introduction of “need to know” basis, protection from disclosure, and anonymity. As detailed in the introduction, financial firms have quite unadulterated access to an overwhelming amount of data on each of their customers. Due to this, to ensure privacy for each user, anonymity is seen as the key trust builder (Chitra and Subashini, 2013). Clifton et al (2002) propose the following definition of individual privacy which preserves k-anonymity aspects while protecting against individual identification:
To highlight the most trustworthy data mining methods, i.e. the methods that preserve privacy best in any given application scenario, an analysis of all relevant advantages and disadvantages of each method must be considered. Aideen et al., conducted such a review and concluded that classification established on “distortion, association rule, hide association rule, taxonomy, clustering, associative classification, outsourced data mining, distributed, and k-anonymity” have all been shown to preserve privacy, albeit to some extent (Aideen et al., 2015). Anonymity has been called out as a key privacy-preserving data mining technique (Aideen et al., 2015).
As the financial sector is transaction-based, item-set mining could be employed, as proposed by Shrivastava et al. (2011), which would result in increased distortion of customer profiles for identification. Item-set mining tunes two probability parameters, nfp and fp, for a minor trade-off in efficiency for privacy. In the Aideen et al. (2015) review, out of the various algorithms reviewed, the item-set mining proves optimal on the condition that the “fraction of frequent items among all the available items is less”. Privacy-preserving data mining should be implemented in various fields to ensure further optimizing of security and efficiency (Aideen et al., 2015).
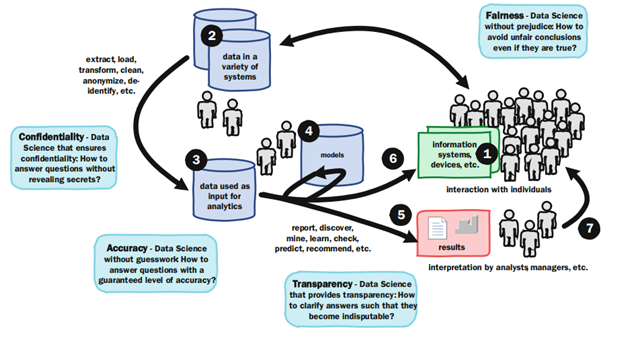
b. RDS Standards Framework
Responsible Data Science (RDS) practices can be illustrated by a firm caring more about how data is handled, stored and processed over all-else (van der Aalst, 2016). RDS can create a standard whereby end-users can instinctively trust a firm’s data mining application as they know the impact on them, and their data, has been considered throughout the mining process (van der Aalst, 2016). By consistently and continuously having the consumer and their needs at the top of the agenda, financial businesses can impact the consumer’s provider choice. By paying heed to the challenges specific to mining customer data outlined by van der Aalst (2016), financial services firms can ensure Fairness, Accuracy, Confidentiality, and Transparency (FACT) for all of their customers and attain/maintain a trusted status (Figure 1) (van der Aalst, 2016).
Figure 1: Data Science Pipeline (van der Aalst, 2016)
Ensuring compliance with international standards for data processing, such as General Data Protection Regulation (GDPR), is a requirement of RDS and can also help infer trust in techniques for consumers (van der Aalst, 2016). Considering the RDS methodology and the results of its implementation outlined by van der Aalst (2016), if financial services firms were to aim for full compliance of the FACT concept under the RDS methodology it can only be assumed that customers could trust a firm’s data-mining practices. External factors, such as the introduction of legislation like GDPR, will only continue to increase ownership and accountability of institutions that hold customer data (Aideen et al., 2015). Trust will, therefore, continue to be a reliable commodity for financial firms to trade on.
Applications
There are a variety of applications for data mining in the financial sector including customer retention, automatic credit card approval, potential fraud detection, and credit score rating assignment. Using privacy-preserving techniques, as highlighted in section 2, consumers can continue to be assured that their data was collected fairly, they are treated equally, and their privacy is protected.
To decide which applications are best suited to a financial firm and their customers’, analysis of customer profiles should be executed (Accenture, 2019). A transparent search for data mining applications or ensuring offerings are equal to, if not better than, competitors is a method a building a trusted reputation that retains and can assist with attaining customers (Delgado-Ballester and Munuera-Alemán, 2005). Demonstration of an ability to apply new technologies well and quickly is very popular among tech-savvy customers (Accenture, 2019). Two major applications of data mining in the financial industry that will be explored further are protected against fraud and the creation of objective credit scores.
Protection against fraud
Creating
reliable fraud protection has been identified as a factor that would increase
36 percent of surveyed consumers’ trust in a financial service company
(Desjardins, 2019). The incentive for banking institutions to prevent fraud rather
than retrospectively detect fraud has never been higher considering global legislation
trends continuing to require refunds for “blameless victims” by banks (Meadows,
2019). Fraud protection is a knowledge-intensive activity as the mining system
must find deviations to the deemed normal patterns of a customers’ transactions
(Ngai et al., 2011). To detect a fraudulent transaction, a clustering technique
would be used so similar “normal” transactions can be grouped. The clustering
algorithm would run across all the transactions for a particular customer
account and a clustering label would be assigned for each observation, for
example, December transactions may be increased due to expenses associated with
Christmas for any given account. Using other datapoints like the geo-location
of the transactions, time of day or frequency of transactions, fraud could be
detected and successfully prevented (Ngai et al., 2011). Decision trees,
logistic model, Bayesian belief network, probability and neural networks are among
other commonly used techniques in industry to detect and classify fraudulent
transactions (Ngai et al., 2011).
Some techniques can be used for certain applications but are not suited for others. For example, probability, specifically probability density estimation method, analyses the “density” of a customer’s past behaviour (Ngai et al., 2011). A customer’s transactions from the last k days would be surveyed and proportions of the estimation would be maximised to maximise the likelihood of the transaction being true or fraudulent (Ngai et al., 2011). This technique requires too much interaction with a billing system to be used in real-time for instantaneous transaction review (Ngai et al., 2011).
Preventing
fraud monetarily benefits the customer and the financial institution. Fraud
detection has many other applications in finance and other industries too. To
build and maintain trust, communication of an instance of fraud prevention to
the associated customer would benefit a financial firm’s reputation, i.e. show
the new technology is working (Accenture, 2019). Follow up investigation of how
an account could have been compromised or what led to the attempted fraudulent
transaction would benefit other customers and that firm’s brand on ability to prevent
further fraud (Ngai et al., 2011).
b. Objective Credit Score Rating and Loan review
Assigning
a credit score rating to loan candidates, whether they are an organisation or
an individual consumer, is a prudent method of risk assessment that financial institutions
globally complete (Siami and Hajimohammadi, 2013). Siami and Hajimohammadi
(2013) outline four categories of scoring that are used by financial firms to
consider a loan application:
Application credit scoring: if the applicant is a new customer to the firm, and no transactional history can be attained for the applicant, the application form contents holds most bearing on the success of the loan.
Behavioural scoring: if the applicant is an existing customer, the institution can review their past transaction history, current account balance, a record of loan repayments, etc.
Collection scoring: customers are grouped by their level of insolvency and the level of attention that will be required while processing the application
Fraud detection: applications are ranked based on the probability of inclusion of fraudulent information by an applicant
Using
data mining as a technique to create credit scores is growing in popularity in the
financial industry (Siami and Hajimohammadi, 2013). There are increased
examples of rule extraction techniques specific to data mining, such as, neural
networks, decision trees and rule-based classifiers being applied to credit application
forms. Post-review of a variety of literature sources, and only considering single,
non-hybrid techniques, Support Vector Machine (SVM) classification achieved the
best results for creation of credit scores and objective review of loan
applications (Huang et al., 2007; Siami and Hajimohammadi, 2013). Relatively
few input features can be used, and an identical clarificatory accuracy can be
achieved with SVM classification (Huang et al., 2007). When considering hybrid
models, there is a lack of general research completed on the topic as there is
an unavailability of credit score data widely available to model a solution
(Siami and Hajimohammadi, 2013). This being stated however, experimental
results have shown that a Gaussian – SVM hybrid has a promising future as a data mining
technique for credit score creation (Huang et al., 2007).
The explicit nature of the application form and the chosen technique’s output, i.e. the application is either accepted or rejected, is easy logic for anyone to understand (Siami and Hajimohammadi, 2013). This contrasts with other data mining technique outputs which are more subjective (Siami and Hajimohammadi, 2013). Due to the sensitive nature of any given reason and the data required to apply for a loan, an objective method of application review ensures the financial institutions and customers’ interests are both met. Financial businesses are logic-driven, as is their policymaking, and so the effective rule design that is enabled with data mining enables further objective thinking applications (Siami and Hajimohammadi, 2013).
Conclusion
Customers
want a financial institution to be invested in their financial success
(Accenture, 2019). This review has demonstrated that a financial firm can
create a personable brand, one which can be trusted, through the utilisation of
the right data mining techniques. The recommended path to becoming a trusted
financial brand is as follows:
Using data mining techniques that preserve user privacy. This technique signals to consumers they are appreciated as individuals as their identity means that much.
Implementing frameworks like Responsible Data Science. Using or creating standards of accountability create a benchmark that customers can easily test a financial provider against. Having such metrics would encourage ownership in the financial industry.
For fraud prevention, it is recommended to use clustering. For new customers, until there are enough transactions to cluster for profile building, it can be more difficult to prevent fraud. It is recommended that a variety of data points are used and learnings from alternate fraud preventions for other customers are applied too. Communication of this care to customers would instantiate a more favourable brand for a given financial firm.
For the creation of credit scores and review of loan applications objectively it is recommended to use SVM. In the coming years, further research may be completed in this area but technique choice should never compromise the objectivity of the output.
A
financial firm communicating that it is taking steps to operate more
transparently with its customers on how they are using data creates a better
brand image as a Corporate Social Performer (Pivato, Misani, and Tencati,
2008). A firm that can make statements like this and live up to the standards,
such as RDS, they hold themselves accountable to, is a brand that could be
worthy of trust (van der Aalst, 2016). Trust
will continue to grow as a reliable commodity for financial firms to trade on
as long as consumers continue to share their data.
Aldeen, Y.A.A.S., Salleh, M. and Razzaque,
M.A., 2015. A comprehensive review on privacy preserving data mining. SpringerPlus, 4(1),
p.694.
Berry, M.J. and Linoff, G.S., 2004. Data
mining techniques: for marketing, sales, and customer relationship management.
John Wiley & Sons.
Clifton, C., Kantarcioglu, M. and Vaidya, J.,
2002, November. Defining privacy for data mining. In National science
foundation workshop on next generation data mining (Vol. 1, No. 26, p.
1).
Chitra, K. and Subashini, B., 2013. Data mining
techniques and its applications in banking sector. International
Journal of Emerging Technology and Advanced Engineering, 3(8),
pp.219-226.
Delgado-Ballester, E. and Luis Munuera-Alemán,
J., 2005. Does brand trust matter to brand equity? Journal of product
& brand management, 14(3), pp.187-196.
Meadows, S. (2019). Blameless fraud victims to be refunded
by banks from May. Available: https://www.telegraph.co.uk/money/consumer-affairs/blameless-fraud-victims-refunded-banks-may/.
Last accessed 11/10/2019.
Huang, C.L., Chen, M.C. and Wang, C.J., 2007.
Credit scoring with a data mining approach based on support vector
machines. Expert systems with applications, 33(4),
pp.847-856.
Jeff Desjardins. (2019). Visualizing the Importance of
Trust to the Banking Industry. Available:
https://www.visualcapitalist.com/trust-banking-industry/ . Last accessed
10/10/2019.
Kim, H.W., Xu, Y. and Gupta, S., 2012. Which is
more important in Internet shopping, perceived price or trust? Electronic
Commerce Research and Applications, 11(3), pp.241-252.
Ngai, E.W., Hu, Y., Wong, Y.H., Chen, Y. and
Sun, X., 2011. The application of data mining techniques in financial fraud
detection: A classification framework and an academic review of
literature. Decision support systems, 50(3),
pp.559-569.
Pivato, S., Misani, N. and Tencati, A., 2008.
The impact of corporate social responsibility on consumer trust: the case of
organic food. Business ethics: A European review, 17(1),
pp.3-12.
Shrivastava
R, Awasthy R, Solanki B (2011) New improved algorithm for mining
privacy—preserving frequent item sets. Int J Comp Sci Inform 1:1–7
Siami, M. and Hajimohammadi, Z., 2013. Credit
scoring in banks and financial institutions via data mining techniques: A
literature review. Journal of AI and Data Mining, 1(2),
pp.119-129.
van der Aalst, W.M., 2016, April. Responsible
data science: using event data in a “people friendly” manner. In International
Conference on Enterprise Information Systems (pp. 3-28). Springer,
Cham.
In the past number of weeks there have been global reports of a large earthquake in Albania causing national havoc and despair, and scores of deaths in New Zealand due to a volcanic eruption. These two occurrences spiked my interest in the world beneath our feet: that of seismic shifts, flowing magma and volatile pressure. These two events were reported to be “undetected” by many global media outlets and such natural occurrences are “unpredictable” (Hall, S, 2019). What this analysis and the final interactive dashboard will attempt to show is how active the earth under our feet is. The completed interactive dashboard can be found on Tableau public site here.
Firstly, to understand the world beneath us and its level of activity, one must understand the following brief fact file of current volcanoes and earthquakes. Considering the premise of this analysis being recent events in Albania and New Zealand, context is given to these particular occurrences.
Question
Answer
Number of active volcanos
globally
According to the Catalogue of the Active Volcanoes of
the World, there are approximately 500 active volcanoes globally (Simkin
et al., 1994)
Magnitude (Mw) measured
on the Richter ScaleScale range 1 – 10
How many recorded Albanian
earthquakes
Since 1267 there have been 26
deadly earthquakes
2019 Albanian earthquake detail
6.4 Mw20 Depth in Km 52 dead, 3000+ injured
As mentioned, the prepared dashboard will attempt to illustrate how active the earth under our feet is, but also how many people are potentially impacted by these occurrences. To achieve this, several reputable data sources were surveyed until the right datasets were obtained. The following section outlines observations from interacting with the dashboard.
Interacting with Tableau Dashboard
Without making any selections, users can see how much earthquake activity there is, the different levels of population globally and which countries have been impacted by volcanoes recently. China and India have far greater populations than other nations. The island nations in the pacific, with relatively high populations, are at the greatest risk of experiencing earthquakes that are above average strength.
When using the dashboard it was found that tableau have intuitive click and drag feature across their maps – rather than just selecting one country, a user can select a multitude of countries quite easily. When using Tableau however, one of the issues that was found when building this dashboard was ensuring that aggregate values were not used.
The level of earthquake activity also shows where the tectonic plates lie without having to drawn them on the map. The pacific ridges are far more active than the Atlantic ridges.
Using the two maps (population and earthquakes) in conjunction we see population overlap or at risk, but with the specific longitude and latitude coordinates given for the earthquake detection users can figure out what level of the population may actually be at risk. Again, the island nations in the Pacific are most at risk of earthquake damage as the volcanos are located on the main islands. Using the zoom function, users can get a better view of this.
There are far fewer volcanic eruptions than the number of active volcanoes highlighted in section 1, over 500. Considering this we can see why volcanoes are hard to predict. Also highlighted is the level of damage caused in the past calendar year by volcanoes.
The treemap of all eruption specific locations in Figure 9 was included on the dashboard for two reasons, to highlight the frequency of earthquake occurrences (over 1800 recorded in 30days) and to highlight how the average magnitude is 4 or below for most earthquakes. Users cannot immediately identify this from the map.
The magnitude range was investigated a little further to understand the severity of each of the earthquakes. Reviewing the scale and the description in Figure 11, between 2 and 4.9 magnitudes is relatively light and not to be too wary of. Anything above 5 is more dangerous and damaging. Considering this, areas with a high population like India have been in immediate danger the past number of weeks.
Considering the figures related to volcanic damage and the country categories, we see particularly the United States suffered a large number of housing damage and Guatemala a close second. Guatemala is the outlier in the number of deaths suffered by the nation. It can be hypothesised that due to the larger amount of wealth in the US, loss of life could have been a lot worse if exit strategies were not in place. The number of millions of loss suffered is also a “reported” figure, where financial losses could have been a lot greater. Financial loss reported damage should also be considered relative to the local nations’ wealth.
The sizing on the public dashboard had to be adjusted as the sizing online is quite different from the desktop version of Tableau. It is suggested that the user maximises their screen.
Conclusion
As a topic, this geological report was found to be an interesting topic to investigate and report on. It was certainly difficult developing an understanding of what normal datasets should include.
The creation of an interactive dashboard was a challenge, as is everything you do for the first time. It was built on a trial and error basis and trying to fit as much information as possible onto one page in a clear and concise manner.
It was learned that although there are a huge number of earthquakes and a large variety of active volcanoes we luckily rarely hear of devastating impacts from these natural giants.
Using learnings from the parallel data mining assignment it would be interesting to run population projections on active volcanoes and plan future dwelling safe zones in volcanically and earthquake active zones. Reviewing historical events, there is usually a mammoth occurrence occasionally, which cannot be planned for but at least humans could be defended more successfully. Further areas of study also include tsunamis, tornados, other natural phenomena
It would be interesting to analyse or develop a dataset for accurate damages costing rather than gathering reports. For the purpose of better analysis, it would be interesting to review the costs for earthquakes and in particular insurance costings for all-natural disasters.
Hall, S. (2019). We’re Barely Listening to the U.S.’s Most Dangerous Volcanoes. Available: https://www.nytimes.com/2019/09/09/science/volcanoes-cascades-monitoring.html. Last accessed 22nd Dec 2019.
Simkin, T., Siebert, L., McClelland, L., Bridge, D., Newhall, C. and Latter, J.H., 1994. Volcanoes of the world: a regional directory, gazetteer, and chronology of volcanism during the last 10,000 years. US Hutchinson Ross Publishing.
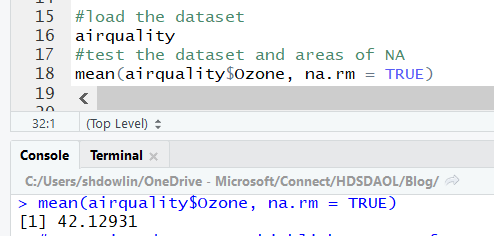
This post highlights methods of exploring and cleaning a dataset. The dataset used is the air quality dataset available in R which contains daily records from five months of measurements from New York in 1973.
Let’s Start – Data Exploration
Load the dataset and understand the base stats of the dataset. Make sure to comment your code
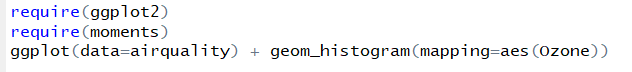
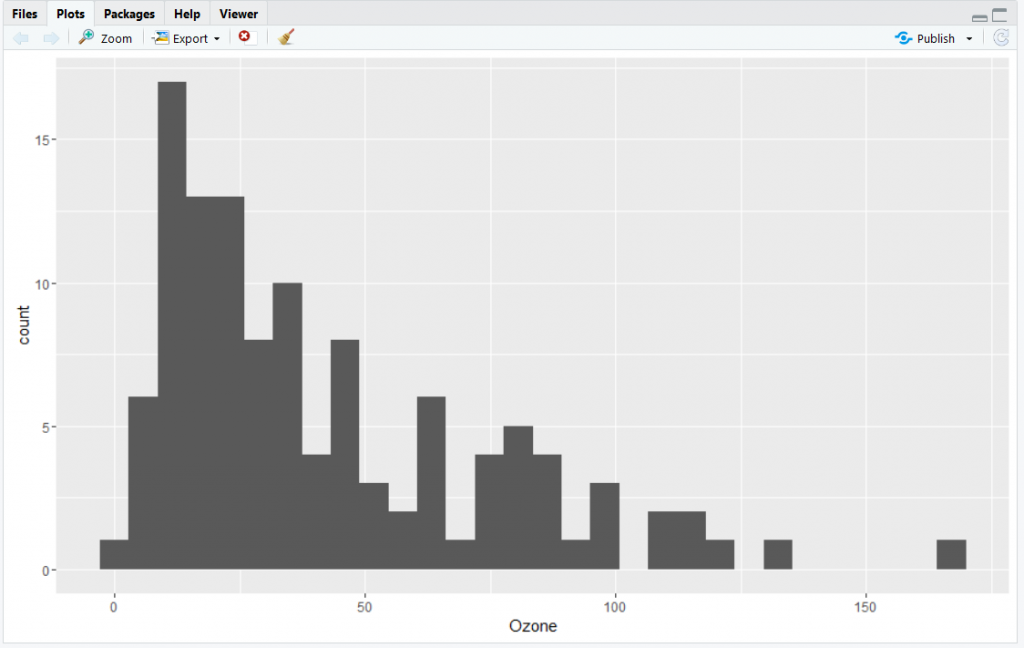
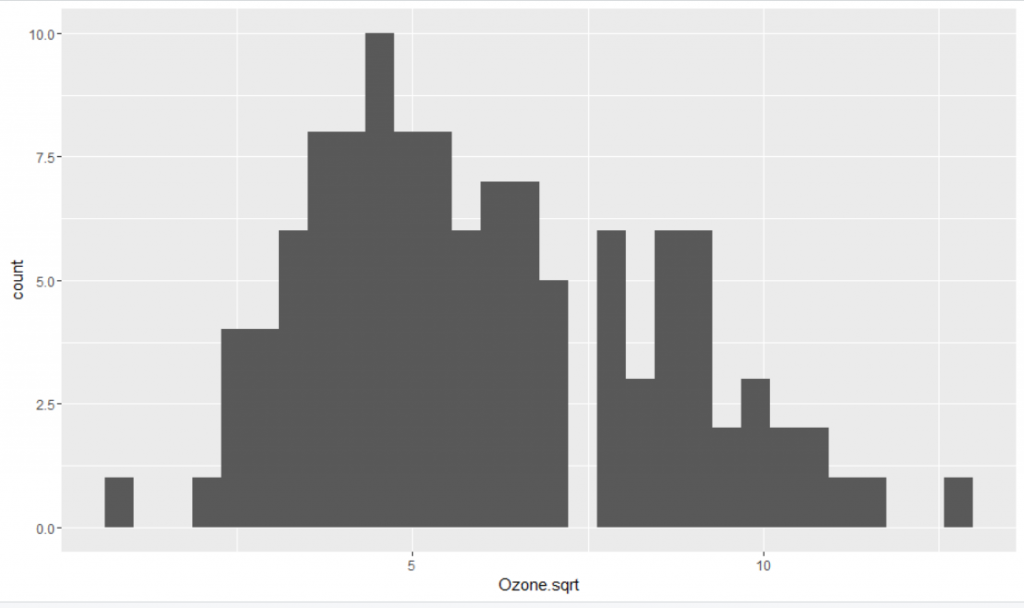
Summarise the dataset using the summary() function and see if there are any gaps in the dataset. Now let’s explore the dataset visually by selecting a single variable, Ozone, and see what that tells us about the dataset.
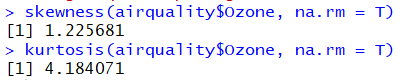
Visually, this histogram looks quite skewed to the right. Analysis of the exact skewness and kurtosis of this asymmetric dataset we see it is highly skewed and leptokurtic.
Data Transformation
Transforming data can help address data that does not fit model assumptions and/or coerce different variables to have similar distributions. As the Ozone data is right-skewed, common right-skewed transformations to be used are square-root, cube root and log. First, we will use square-root transformation improves distribution.
Using the code above, the square-root of Ozone concentration in the airquality dataset has been stored as a new column. The dataset visually certainly looks more symmetric. Using the same skewness and kurtosis code to analyse the transformed data we see that the dataset has become more symmetric with skewness = 0.5143488 and kurtosis = 2.561186 .
Remove gaps in the dataset
You can see there are 37 NA’s in Ozone and 7 NA’s in Solar. Create an if-else statement to remove the NA’s and re-run the summary to test.
If a question mark symbol (?) is used instead of NA, you will need to write a regular expression to remove this character if there are fewer columns, but generally, you can write a function as above. Use regular expressions to identify unwanted characters. To create the most accessible code, use R packages, like stringr or functions like gsub. To write comprehensive code, you could decide to remove all punctuation characters;
x <- "a1~!@#$%^&*(){}_+:\"<>?,./;'[]-="
str_replace_all(x, "[[:punct:]]", " ")
#(The base R equivalent is gsub("[[:punct:]]", " ", x).)
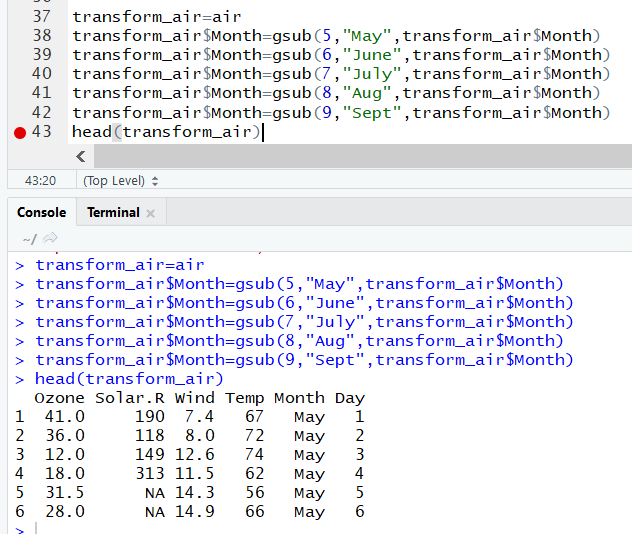
Add information
By understanding your dataset, you can add data or information so others can consume the information faster. Below we see month information has been added using the gsub function. It is relatively simple to implement but can really assist when you try and visualise a report on any given dataset.
Custom Columns
Adding columns can assist with exploring the dataset and developing key insights it may contain. Subsequent columns can be added to help highlight certain points or arguments trying to be made. Using the example of the airquality dataset, a custom column has been added in order to analyse the air quality at unsafe levels, > 100 p.p.m.
The premise for this blog post is that a database for a retail store has been created. All completed transactions will be stored within this database and the database can deal with the various transaction and payment types. All necessary tables and relationships have been considered and appropriate primary keys, foreign keys and constraints assigned. The system was populated with sufficient random data and all attribute names are sensical. The below commands show how I created bespoke reports for the retailer.
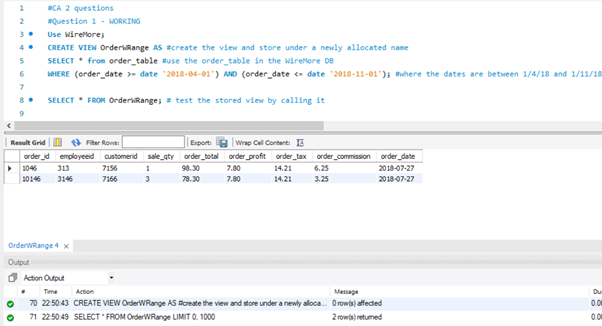
(View) – Show all transactions for ANY given week (you decide the dates).
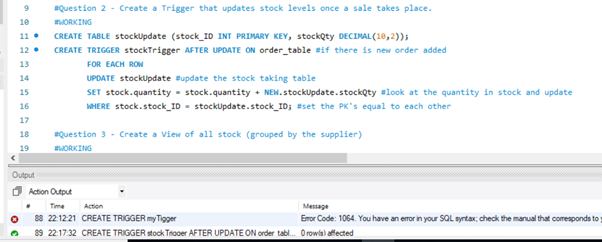
(Trigger) – Create a Trigger that updates stock levels once a sale takes place.
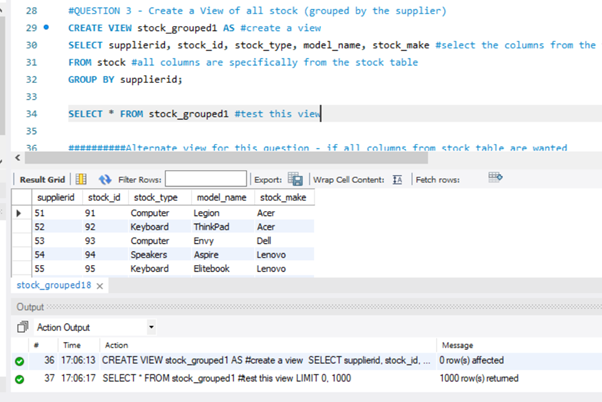
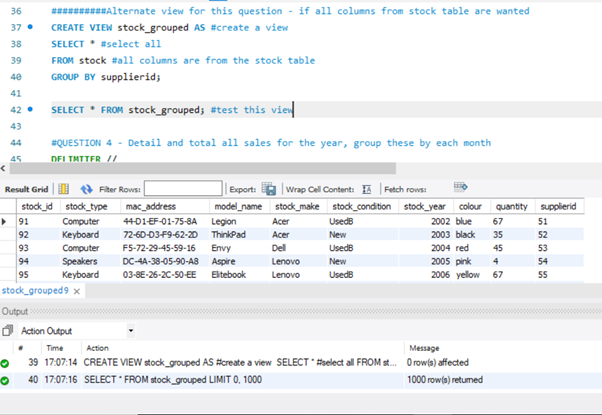
(View) – Create a View of all stock (grouped by the supplier)
(Stored Procedure) – Detail and total all sales for the year, group these by each month. (A Group By with RollUp)
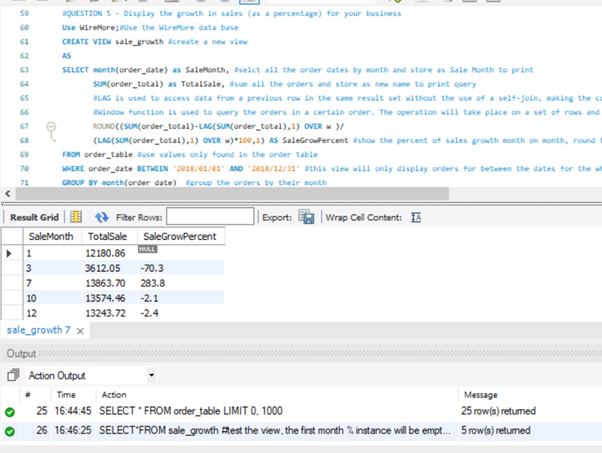
(View) – Display the growth in sales (as a percentage) for your business, from the 1st month of opening until the end of the year.
The first SaleGrowPercent value is null as expected as there is no month in the range before January 2018 to compare
(Stored Procedure) – Create a stored procedure that will display all orders by customer and their county.
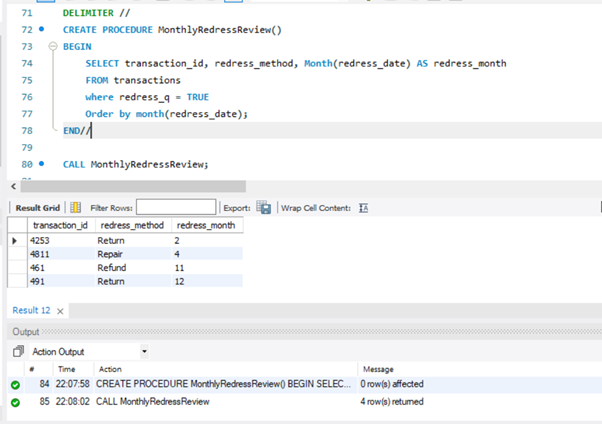
(Stored Procedure) – Create a stored procedure that will display all returns, grouped by month.
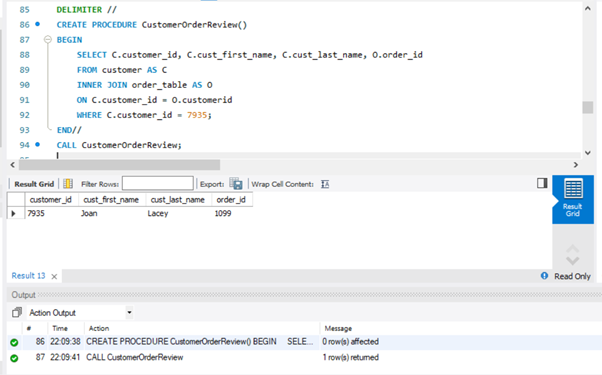
(Stored Procedure) – Display specific customers’ details and all of their relevant orders to date by passing a parameter (eg: CustomerID).
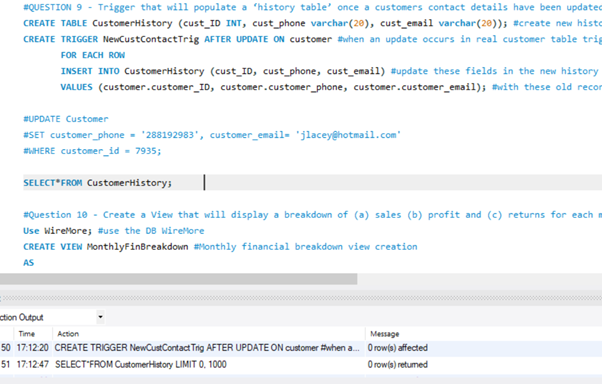
(Trigger) – Create a Trigger that will populate a ‘history table’ once a customers contact details have been updated.
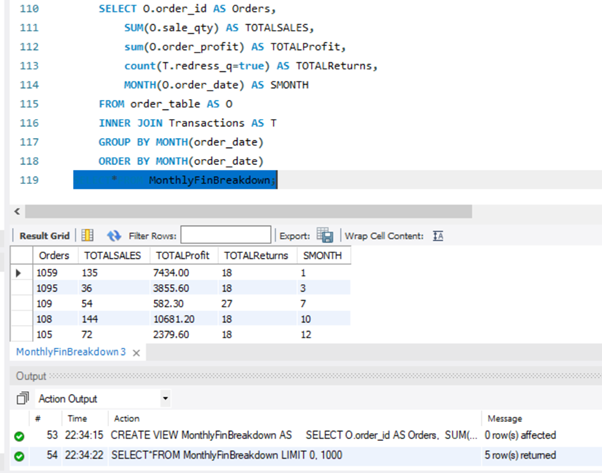
(View) – Create a View that will display a breakdown of (a) sales (b) profit and (c) returns for each month of the year.
After completing each of the individual reports, you are required to add all of the above scripts into one unique SQL file that will run all of the scripts together and output the data into a Data Mart