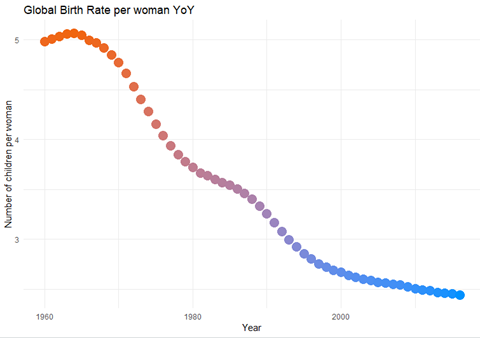
It is well known that the global population is on the rise (Meyer and Turner, 1992). This hypothesis sets out to show that this is contributed to our global fertility. In the case of the dataset used, fertility is defined as births per woman. If we look at Figure 1 however, we immediately see there is globally a decrease of fertility year on year. Contained within the data set there were pre-grouped regions and one of these was labelled “world” which was considered to create this graph.
Figure 1: Global fertility rate year on year
As we gained the insight that the birth rate is generally declining, it was then decided to look at where births are still on the rise through a visual heat map. This was the most technically difficult piece to this assignment. Issues were encountered with data types initially. Then the solution trying to be modelled on was using a google API which was no longer free. The free trial was then engaged with, but the initial quota was quickly used up. Using other methods of mapping was difficult without longitude or latitude details matched to the data. The data was got from this site: https://developers.google.com/public-data/docs/canonical/countries_csv. So, a dataset was found and then merged with the fertility dataset. In Figure 2 we see that generally, Europe and North America have lower birth rates than developing nations in Africa and East Asia Pacific island nations. All groupings that were originally in the dataset had to be removed to show this visualisation.
Figure 2: Birth Rate Globally
References
Meyer, W.B. and Turner, B.L., 1992. Human population growth and global land-use/cover change. Annual review of ecology and systematics, 23(1), pp.39-61.
The objective of this hypothesis is to see if the level of investment by governments into educational research causes a positive or negative effect on the general health of a nation. The assumption of this hypothesis, similarly with hypothesis 2, is that the level of pharmaceutical spend of a country is indicative of its health. Immediately the total global spend on higher education R&D and pharmaceutical spend were calculated.
> sum(maxdata$Higher.Education)
[1] 492082523
> sum(Pharmaspend$TOTAL_SPEND)
[1] 12188978
From this, we can see that pharmaceutical spend globally is just 2.477% of the overall higher education research expenditure.
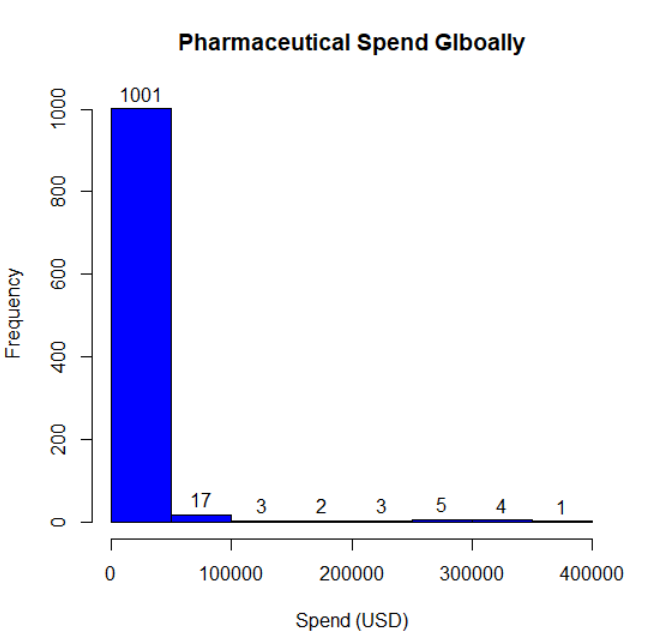
From here, the general frequency of spend globally on pharmaceuticals was reviewed. Using another proved hypothesis, it could be concluded from Figure 1 that most countries represented in the dataset are in good health. There are some outliers in this visualisation, however. Labels were added to this visualisation to analysis the frequency further. The x-axis limit had to be extended to 1010 to ensure that top label was not cut off.
Figure 1: Fully labelled histogram of global pharma spend frequency
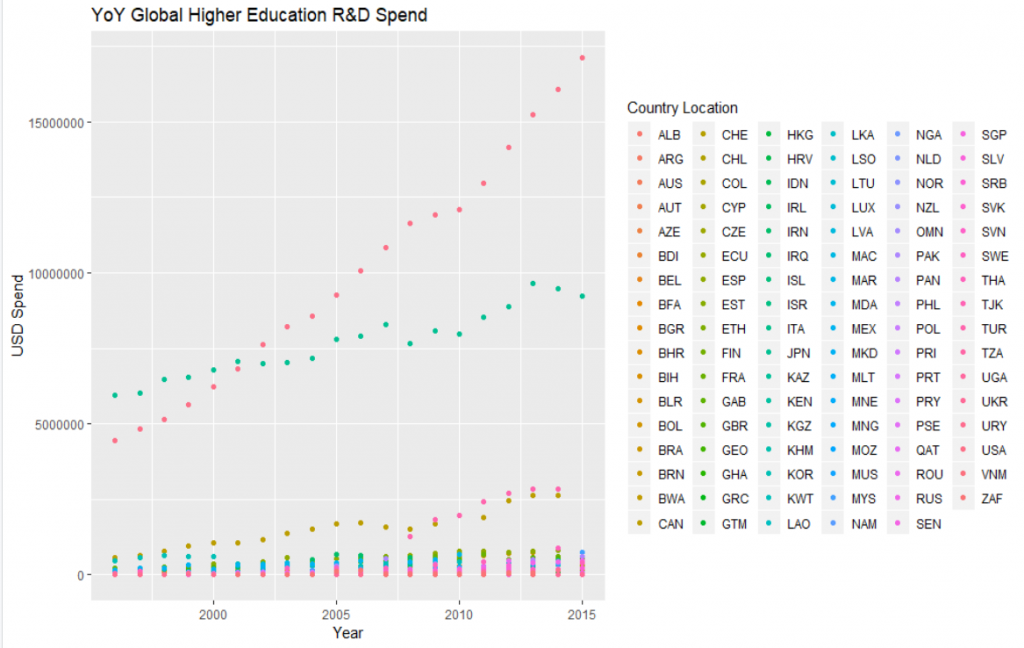
As with the pharma spend data set, the R&D spend category of higher education was put into a visual form to get more information about its contents. Using ggplot and R Colour Brewer package libraries, the visualisation in Figure 2 can be seen. Immediately, as with the other spend analysis complete, the United States of America is the largest spender. Japan is the closest second place.
Figure 2: Dataset representation of global spend year-on-year on national higher education
To explore the hypothesis set out further, the two datasets were then merged. The common field to merge on was TIME, i.e. year. Initially, there were difficulties with merging due to syntax issues. To see both higher education and pharmaceutical spend on one chart subsets of the merged dataset were created. Difficulties were had to try to create a legend for these subsets, but labels were able to be added to the chart. From the original analysis of the global spends, the higher line for all countries represented in Figure 3 and 4 are the higher education spend. Colour names were reviewed online and added manually to ensure each country represented had a similar schema.
Figure 3: The outliers globally for pharmaceutical spend, USA and Japan and their respective higher education spend.
In Figure 3, we can see that the global economic recession did not affect USA spending in either education or pharma categories. Japan was affected slightly in 2008 though. From this visualisation the hypothesis is false; the more a country spends on higher education the less it will spend on pharmaceuticals. The USA max spend is just <15,500,000 and Japan is <10,000,000. This level of a gap is not reflected between their respective pharmaceutical spend.
As Figure 3 reflects the outliers of the dataset that spend most in one category, the minimum spender for pharmaceutical spend was then found. This was Iceland in 1970 with a grand total spend of $6.29. This figure would call into question the completeness of the dataset as it does not seem reasonable for a country to have such a total for national spend.
Considering
the size of Iceland, other small European countries that were represented in
both datasets were chosen and plotted for year-on-year analysis.
Figure 4: Sample of European countries their pharmaceutical and education R&D spend. Included is Iceland who globally spends the lease on pharmaceuticals nationally.
In Figure 4 we can visually see other issues that would call into question the validity of the dataset; Austrian higher education R&D spend for example only had 2 years of data. Irish data gives interesting insight that there was a progressive decline of education spending after the recession and it has not regained levels it was at. There was also a sharp dip during the boom. The minimum spender in the dataset, Iceland, is comparable to the other countries represented for pharmaceutical spend but its higher education is greater than Luxembourg. Considering the analysis of the max spenders on pharmaceuticals, the hypothesis set out is disproven. Pharmaceutical and higher education research and development spends are unrelated but pharmaceutical spends globally are on a steady rise.
The objective of this hypothesis is to show that by looking at the prosperity of a country economically, you will immediately gain insight into what the state of the country’s health is like. This hypothesis has been widely proven inversely – by looking and analysing countries with health epidemics, you will be able to analyse its GDP (Anderson and Frogner, 2008). It has been published, for example, that economic growth in African countries slowed by 1.3% annually due to malaria. The effect of which has now resulted in a 37% lower GDP rate if malaria has been absent (Ashraf, Lester and Weil, 2008). To gain immediate visual insight a scatterplot matrix was created for the whole global dataset. The variables included were GDP percentage, pharmaceutical percentage spend, and total spend. Using this visualisation enables multiple variable comparisons at one time. The global scatterplot matrix created was quite crowded and not very readable (Figure 2). After considering the previous research findings of the African content, regional subsets of available countries were created (Figure 1, 3, 4). Although a large dataset, one of its disadvantages was that it gave an incomplete representation of all countries.
Figure 1: Europe and Central Asia pharma spend
Figure 2: Full data set (as global as possible) view of pharmaceutical spend
Figure 3: United States of America’s pharmaceutical spending
Figure 4: East Asia regional pharmaceutical spend
Some trends can be seen regionally and globally the spend on pharmaceuticals has gone up over the recent years, but the USA is truly an outlier. Due to prior knowledge of this assignment, it is known that Japan and Germany are ageing populations. With another dataset, it would be interesting to see if the age of a population influences the level of pharmaceuticals it buys. Percentage GDP versus pharma expenditure is most closely correlated in Europe throughout all the countries in that region. Although there are disparities between levels of spending in the Americas, the countries here are correlating positively and growth in pharmaceutical spend steady over the years in the dataset.
Using
the hypothesis set out and reviewing the scatterplot matrices, we can conclude;
The Americas are in poor health
Europe and Central Asia are in good health but have a maturing population
The East Asia Pacific plots, although varying spend levels, largely have a positive correlation between percentage health expenditure, GDP and total health expenditure
From alternate
research
It is seen that the United States has the largest nominal GDP globally. This insight from the dataset is therefore disproven
Europe does have an ageing population and a modern society consequence of this is an increase in pharmaceutical spend (Lee and Mason, 2011)
The countries contained within this regional grouping have varying levels of productivity and wealth (Moneta and Rüffer, 2009). With a larger dataset of countries from the region, further sub-regions could be broken out to review.